MEMBUAT TABEL BAHASA INNGRIS DENGAN MUDAH DAN PRAKTIS
UNDERSTANDING TABLES
Ciao bro penonton pada sesi ini saya akan mencontohkan membuat tabel Bahasa Inggris yang simpel dan mudah.
Yang pertama kita harus mengenali tabel itu
tersendiri bukan hanya orang saja yang harus kita kenal tabel pun juga, berikut
adalah definisi, fungsi, dan tipe-tipe tabel yang harus kalian ketahui terlebih
dahulu.
1. Understanding tables
1) Definitions
a) A
table is an arrangement of data in rows and columns, or perhaps in a more
complex structure. Tables are widely used in communication, research, and data
analysis. Tables frequently appear in print, writing, computer software, ornate
architecture, traffic signs, and so on.
2) Function
a) Provide
concise information
b) Easy
Reader
c) Generalizing
Communications
3) Type
of tables
a) One
Way Tables/ Simple Tables
One-way tables provide information about one
characteristic only. These characteristics vary such as amount, frequency, size
which are usually expressed in numbers. One-way tables are the simplest and
easiest type of tables to create.
b) A
two-way table is a type of table that presents the relationship between two
characteristics.
c) Three
Way Tables/ High Level Tables/Manifold Tables
A three-way table is a type of table that presents the relationship between three characteristics at once.
Setelah
kalian mempelajari dan perkenalan dengan tabel, berikut adalah contoh tabel
2. Sample
of Tables
The table shows how people in different age groups spent their leisure
time in some land at 2020. It can be clearly seen that the amount of leisure time
available varied considerably across the age groups.
We can find
the information about:
1) Teenagers and people in their twenties spend on
average 500 hours per year on socializing and 350 hours of that time is with a
group of more than 4 people.
2) Although the total
hours of socializing in their 30s, 40s, 50s and 60s is fairly constant (between
300-350), socializing with more than 4 people drops dramatically to 50 hours in
the 30s and 40s age groups and only 25 from 50 years old.
3) People
of all ages spend a good part of their leisure time on entertainment such as
TV/video viewing and cinema.
Nah kan
kita sudah mengetahui contoh dari tabel, sekarang kita belajar untuk membuat
tabel ya bro penonton
3. Writing
Tables
1)
Tables
1
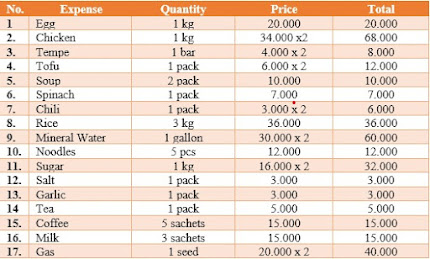
FAMILY
EXPENSE
A WEEK
We can see the table above there are 4 kinds of items. The items tell about expanse, quantity, price, and total.
Items:
a) Tells
the type of groceries purchased in a week
b) Tells
the quantity/weight of the item purchased
c) Tells
the price of the goods purchased
d) Tells about the total price
The table above tells about the items that my family buys in a week and my family can spend 352.000 rupiah.
2)
Tables
2
Below is about the expense of a house building that
will be built for 6 months
300 Million House Construction Plan
The table above is a table for building a house worth 300 million with 6
months of work.
The cheapest planning is in the concrete structure work section and the most expensive is in the land purchase section because land is now scarce and expensive.
Sekian dan terimakasih ya bro penonton telah melihat sedikit tutorial
dari saya kalau belum jelas dan belum paham dibawah ini ada referensi link
tentang tabel.
Reference:
https://www.ielts-writing.info/EXAM/preparing/Writing_task_one_tables/212/
ADIOS
BRO PENONTON


very good.. more developed for the words
BalasHapus